My 2024 Job Search
In the middle of 2024, I was looking for a new job opportunity in the field of Data Science / Analytics and collected plenty of interesting data on the jobs available at that point. As a result, I produced some analyses and visualisations that could be interesting to those interested to apply to a Data Scientist position.
Application statistics
First, some facts on the application process:
- When I started applying, I was 27 years of age, with roughly 3 years of experience working as a Data Scientist and Data Analyst;
- I have a BSc in Nutrition and MSc in Biotechnology (Bioinformatics);
- Over a period of 01.05.2024 - 16.07.2024 (roughly 2.5 months), I made a total of 501 job applications.
Job application website
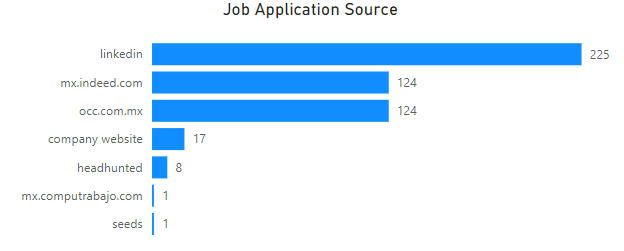
The most used website for applying was Linkedin; it has the most applications submitted due to the Easy apply option for many job postings. The second two most often used websites are mx.indeed.com and occ.com.mx. The category headhunted mostly contains cases when I was contacted by companies via recommendations or my linkedin. Interestingly, there is one case when I was approach by a recruiter who found my profile on GitHub and was impressed by my activity there!
Job titles and skills
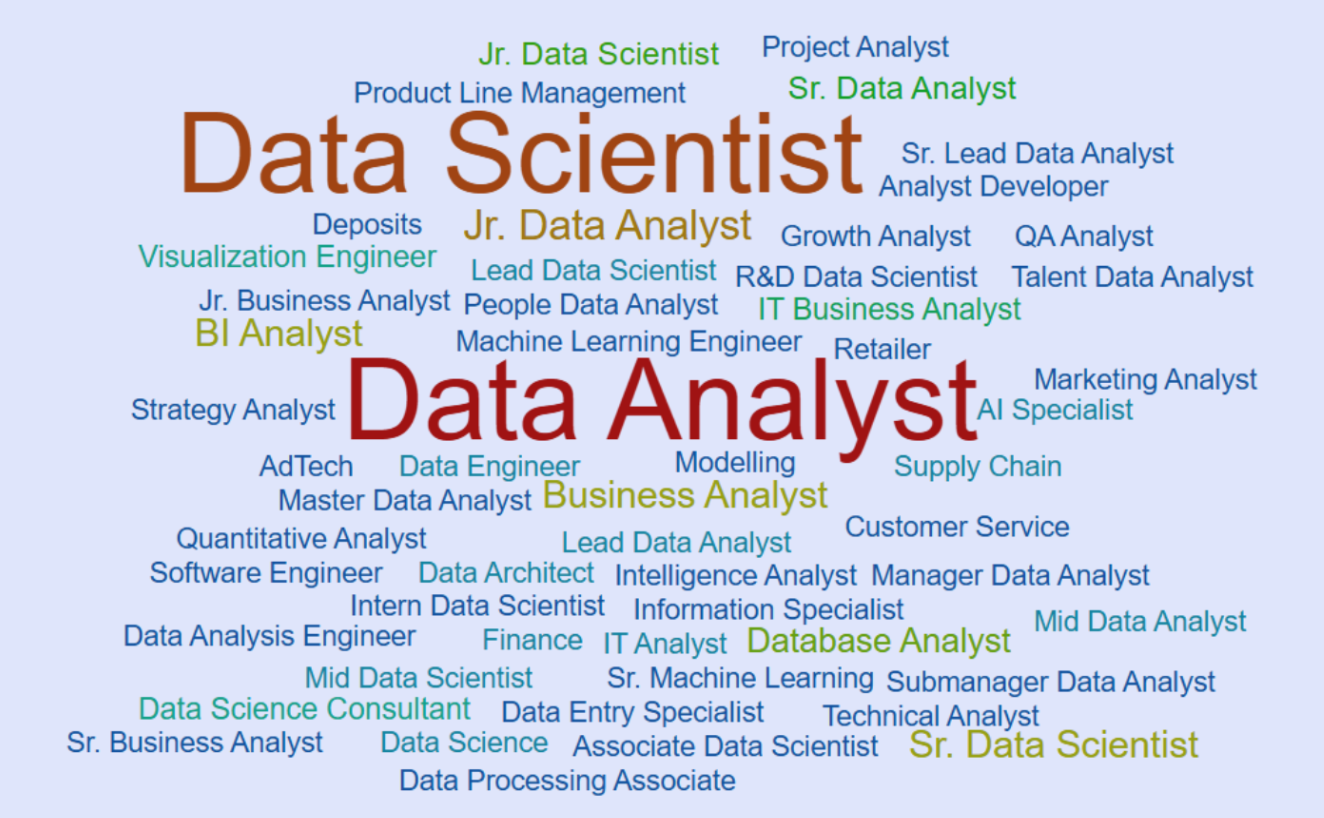
The titles of the jobs I applied for can be seen in the word cloud below. Please note that the original diversity was reduced by making the following adjustments to the job titles of the postings:
- Removed mode of work: hybrid, remote, on-site
- Removed location: Mexico, Santa Fe, Switzerland, etc.
- Split numerous keywords into smaller ones, e.g. “Data Analyst with Power BI” into “Data Analyst” and “Power BI”
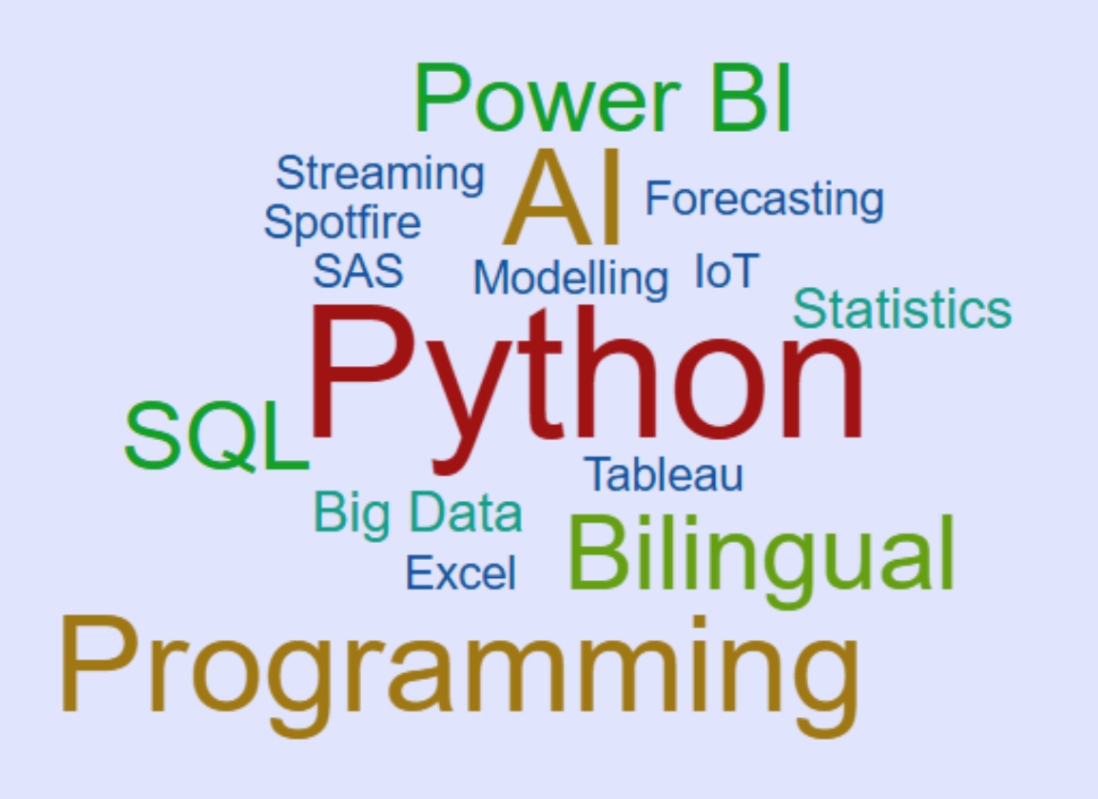
- Skill-related keywords, such as “bilingual”, “python”, “SQL”, were placed into a separate word cloud that follows the one below.
Job titles word cloud
Skills and proficiencies word cloud
As mentioned above, these skills and proficiencies were extracted from the job title only; unfortunately, I didn’t have enough data (or time) to also collect data for skills required for job postings in the descriptions, but this could be a very interesting separate project.
Work mode and location
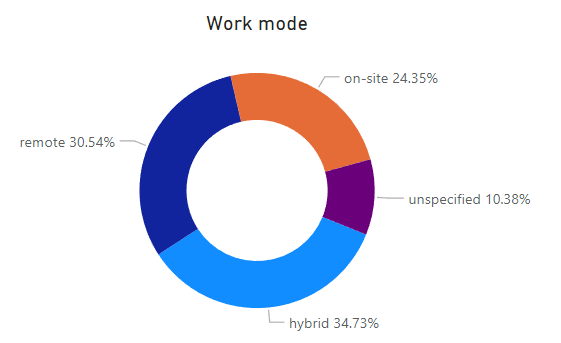
The applied jobs were roughly equally mixed in their work modality:
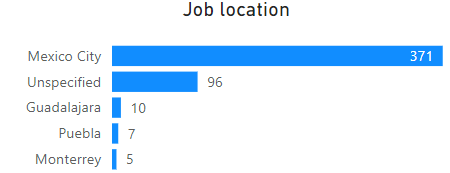
As for the location of the job postings, most of those that I applied for were in Mexico city:
Salary and experience
For the jobs below we can assume that the salary is given in brutos (i.e. before taxes). Although some did say that their salaries were in netos (i.e. after the taxes), the majority either specified brutos or not at all, so we shall assume that all of them are brutos. Median salary was taken in order to not have extreme salary offers skew the central tendency measures for each experience category (as a side note, I also checked the means of salaries, and the numbers did not differ too much from the ones presented here; therefore, the offers did not stray too far from the mean/median).
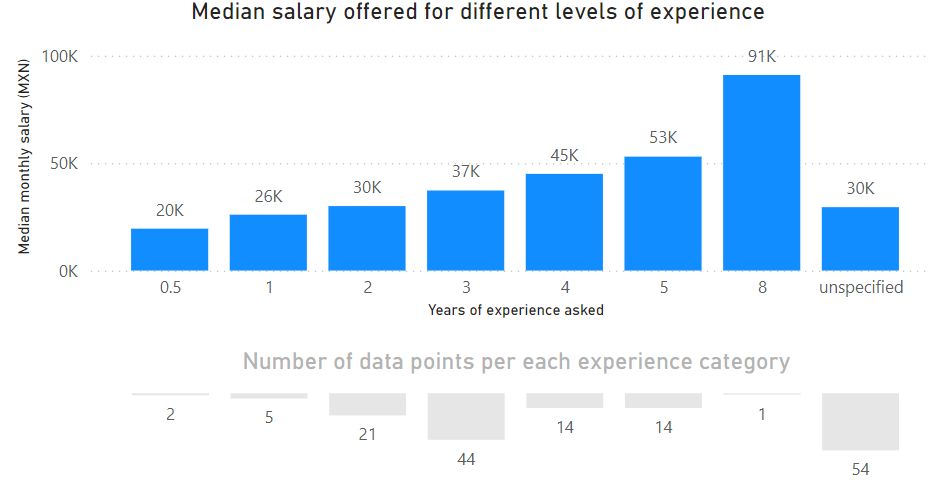
The salaries are given in Mexican pesos
On the plot, we can see that the majority of specified salaries (not counting the “unspecified” group) belong to the 3 years of experience group. This makes sense as this is considered to be the threshold for transitioning from a Junior to Mid Data Scientist in terms of the level of seniority.
It is also interesting to note that the salary offers for each additional year of experience, starting with the “2 years of experience” group, grow approximately 7,000 pesos per extra year. Therefore, while the salary offer for “8 years of experience” on the plot may be too high (as it is a single observation), if we experience the calculated growth, the estimate would be 74,000, which is not too far from the single observation.
Application outcomes
Here is the Sankey diagram of the application progress. The striking observation that can be made instantly is that approximately 90% of the times the recruiters did not respond; having talked with other Data Analysts and Data Scientists, this seems to be a wide-spread trend in the modern work search landscape.

Apart from the activities outlined in the diagram above, I also had to take 10 online tests that on average lasted 30 minutes each.
Take-home lessons
There are different things I learned from this experience.
💔 Bad things:
- For the majority of applications, you will likely not get a reply;
- Recruitment in the middle - and large-sized companies can take a very long time (weeks to months) so be patient.
✅ Good things:
- Excellent benefits: For middle-sized and big companies looking for 3+ years of experience, the benefits have been consistently numerous and excellent;
🧠 Most important skills:
- Python: the working knowledge of Python is a must for a Data Scientist;
- SQL: if you get to a technical part of a Data Science interview, you will inevitably be asked to solve an SQL question, so it is important that you prepare for this;
- general ML
- Working with cloud-based servers, such as Google Cloud, Azure, or AWS
Note
I made the visualisations in Power BI. The word cloud was made on this free website. The Sankey Diagram was made here.